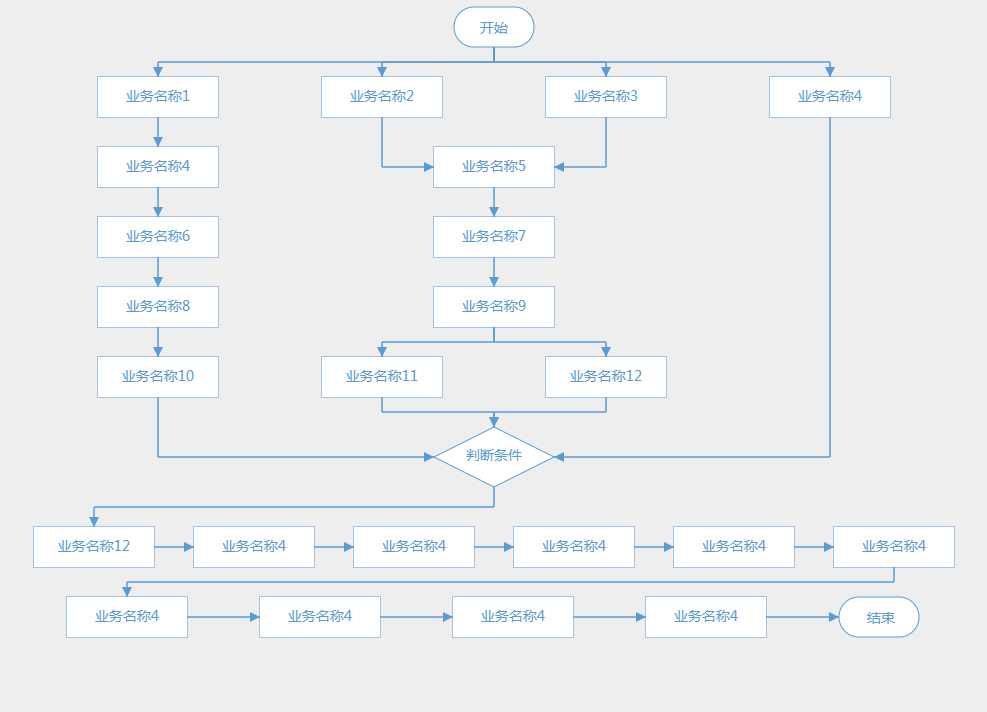
最近在做一个需求,根据数据动态生成以下类似的流程图,需要可以设置每个节点的颜色,每个节点可添加点击移动等相关的事件
代码中有做很多的注释和说明,相关的文档说明链接:https://9eb75i.axshare.com
drawFlowChart.js
//画流程图
//画所有的图形:画图和画对应的箭头
function drawFlowChart(context,canvas,flowdata,initTop, initSpaceH){
  //1、判断是否有需要平均计算x的数据
  flowdata.forEach(function(row){
    if(row.isAverage){
      row.data = calChartX(canvas.width,row.data, row.y);
    }
  });
  //2、先要画完所有的图形
  flowdata.forEach(function(row,rowIndex){
    row.y = row.y ? row.y : ( rowIndex==0 ? initTop + initSpaceH : initTop + initSpaceH*rowIndex);
    row = drawRowChart(context, row);  //画图形
  });
  //3、添加要指向的对象,必须要在画完所有图形之后
  flowdata.forEach(function(row){
    row.data.forEach(function(item){
      if(item.arrowArr && item.arrowArr.length){
        item.arrowArr.forEach(function(mItem){
          mItem = addToObj(mItem,flowdata);
        })
      }
    })
  });
  //4、给所有图形画上对应的画箭头,必须要在前两步完成之后
  flowdata.forEach(function(row,rowIndex){
    row.data.forEach(function(item){
      if(item.arrowArr && item.arrowArr.length){
        drawSingleArrow(context,item);//画箭头
      }
    })
  });
  //5、给所有元素添加点击和悬浮事件
  addMethod(canvas,flowdata)
}
//当一行有n个图形并且需要平均排列时用此方法计算每个图形的x
function calChartX(canvasW,data, dataY){
  var startW = 80;
  var stepW = 120;
  var CondW = 30;
  var count = 0;
  for(var i=0;i<data.length;i++){
    if(data[i].type == 'Step'){
      count += stepW;
    }else if(data[i].type == 'Start' || data[i].type == 'End'){
      count += startW;
    }else if(data[i].type == 'Condition'){
      count += CondW;
    }
  }
  //spaceW 计算一行中每个图形的平均间距
  var spaceW = parseInt((canvasW - count)/(data.length+1));
  //计算坐标x
  var prevDiv = [], curW = 0;
  for(var i=0;i<data.length;i++){
    if(data[i].type == 'Step'){
      prevDiv.push(stepW);
      curW = stepW/2;
    }else if(data[i].type == 'Start' || data[i].type == 'End'){
      prevDiv.push(startW);
      curW = startW/2;
    }else if(data[i].type == 'Condition'){
      prevDiv.push(CondW);
      curW = CondW/2;
    }
    var preLength = 0;
    for(var j=0;j<i;j++){
      preLength += prevDiv[j];
    }
    var x = spaceW*(i+1)+preLength+curW;
    var y = data[i].y;
    data[i]['x'] = x;
    data[i]['y'] = y ? y : dataY;
  }
  return data;
}
//生成每列对应的图形
function drawRowChart(context, row){
  row.data.forEach(function(item,index){
    var s = null;
    item.y =  item.y ? item.y : row.y;
    if(item.type == 'Step'){
      s = new Step(context,item.x,item.y,item);
    }else if(item.type == 'Condition'){
      s = new Condition(context,item.x,item.y,item);
    }else if(item.type == 'End'){
      s = new End(context,item.x,item.y,item);
    }else if(item.type == 'Start'){
      s = new Start(context,item.x,item.y,item);
    }
    item.chartObj = s;
  })
  return row;
}
//绘制单个的图形
function drawSingleChart(context,item){
  var s = '';
  if(item.type == 'Step'){
    s = new Step(context,item.x,item.y,item);
  }else if(item.type == 'Condition'){
    s = new Condition(context,item.x,item.y,item);
  }else if(item.type == 'End'){
    s = new End(context,item.x,item.y,item);
  }else if(item.type == 'Start'){
    s = new Start(context,item.x,item.y,item);
  }
  item.chartObj = s;
  return item;
}
//每个对象的坐标范围
function calRange(obj){
  var newObj = {
    minX:obj.x-obj.w/2,
    maxX:obj.x+obj.w/2,
    minY:obj.y-obj.h/2,
    maxY:obj.y+obj.h/2
  }
  return newObj;
}
//处理每一个箭头需要指向的对象
function addToObj(arrObj,flowData){
  flowData.forEach(function(rows){
    rows.data.forEach(function(item){
      if(item.name == arrObj.to){
        arrObj.to = item.chartObj;
      }
    })

  })
  return arrObj;
}
//话每个图形的箭头指向
funct