81 23.711 0.000
.x7 4.432 0.086 51.540 0.000
.x8 5.563 0.078 71.087 0.000
.x9 5.418 0.079 68.153 0.000
visual 0.000
textual 0.000
speed 0.000
Variances:
Estimate Std.Err z-value P(>|z|)
.x1 0.551 0.137 4.010 0.000
.x2 1.258 0.155 8.117 0.000
.x3 0.882 0.128 6.884 0.000
.x4 0.434 0.070 6.238 0.000
.x5 0.508 0.082 6.229 0.000
.x6 0.266 0.050 5.294 0.000
.x7 0.849 0.114 7.468 0.000
.x8 0.515 0.095 5.409 0.000
.x9 0.658 0.096 6.865 0.000
visual 0.805 0.171 4.714 0.000
textual 0.913 0.137 6.651 0.000
speed 0.305 0.078 3.920 0.000
Group 2 [Grant-White]:
Latent Variables:
Estimate Std.Err z-value P(>|z|)
visual =~
x1 1.000
x2 (.p2.) 0.599 0.100 5.979 0.000
x3 (.p3.) 0.784 0.108 7.267 0.000
textual =~
x4 1.000
x5 (.p5.) 1.083 0.067 16.049 0.000
x6 (.p6.) 0.912 0.058 15.785 0.000
speed =~
x7 1.000
x8 (.p8.) 1.201 0.155 7.738 0.000
x9 (.p9.) 1.038 0.136 7.629 0.000
Covariances:
Estimate Std.Err z-value P(>|z|)
visual ~~
textual 0.437 0.099 4.423 0.000
speed 0.314 0.079 3.958 0.000
textual ~~
speed 0.226 0.072 3.144 0.002
Intercepts:
Estimate Std.Err z-value P(>|z|)
.x1 4.930 0.097 50.763 0.000
.x2 6.200 0.091 68.379 0.000
.x3 1.996 0.085 23.455 0.000
.x4 3.317 0.092 35.950 0.000
.x5 4.712 0.100 47.173 0.000
.x6 2.469 0.091 27.248 0.000
.x7 3.921 0.086 45.555 0.000
.x8 5.488 0.087 63.257 0.000
.x9 5.327 0.085 62.786 0.000
visual 0.000
textual 0.000
speed 0.000
Variances:
Estimate Std.Err z-value P(>|z|)
.x1 0.645 0.127 5.084 0.000
.x2 0.933 0.121 7.732 0.000
.x3 0.605 0.096 6.282 0.000
.x4 0.329 0.062 5.279 0.000
.x5 0.384 0.073 5.270 0.000
.x6 0.437 0.067 6.576 0.000
.x7 0.599 0.090 6.651 0.000
.x8 0.406 0.089 4.541 0.000
.x9 0.532 0.086 6.202 0.000
visual 0.722 0.161 4.490 0.000
textual 0.906 0.136 6.646 0.000
speed 0.475 0.109 4.347 0.000
group.equal()的其他的参数就不翻译了,太累。
- intercepts: the intercepts of the observed variables
- means: the intercepts/means of the latent variables
- residuals: the residual variances of the observed variables
- residual.covariances: the residual covariances of the observed variables
- lv.variances: the (residual) variances of the latent variables
- lv.covariances: the (residual) covariances of the latent varibles
- regressions: all regression coefficients in the model
8.4 测量不变性
因子分析的测量不变性(Measurement Invariance)是指测验的观察变量与潜变量之间的关系在不同组别或时间点上保持不变。测量不变性的成立是进行有意义组间比较的重要前提。可以用semTools包的measurementInvariance()函数来按特定次序执行多组分析,每个模型都与基线模型比较并且对先前的模型进行卡方差异性检验,并且展示拟合度量差别。不过这个方法仍旧比较原始。
library(semTools)
measurementInvariance(HS.model,
                      data = HolzingerSwineford1939,
                      group = "school")
9. 增长曲线模型
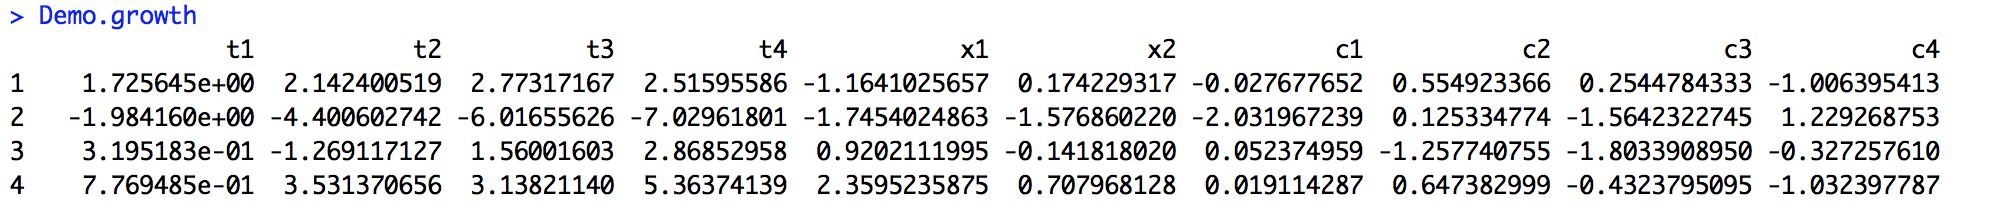
潜变量模型的另一个重要种类是潜增长曲线模型。增长模型常用于分析纵向和发展数据。这种数据的结果度量基于几个场景,我们需要研究跨时间变化。在许多情况下,随时间变化的轨迹可以用简单线性或二次函数曲线来模拟。随机效应用来捕捉个体间差异,这种随机效应可以很方便地用潜变量表示,也叫做增长因子。
在以下例子中,我们使用人工数据Demo.growth(),包含4个时间点。为了在4个时间点上拟合线性增长模型,我们需要用到含有一个随机截距潜变量和一个随机斜率潜变量的模型。
模型如下:
# linear growth model with 4 timepoints
# intercept and slope with fixed coefficients
 i =~ 1*t1 + 1*t2 + 1*t3 + 1*t4
 s =~ 0*t1 + 1*t2 + 2*t3 + 3*t4
数据格式如下:
代码如下:
model <- 'i =~ 1*t1 + 1*t2 + 1*t3 + 1*t4
          s =~ 0*t1 + 1*t2 + 2*t3 + 3*t4'
fit <- growth(model, data = Demo.growth)
summary(fit)
结果如下:
lavaan (0.5-23.1097) converged normally after  29 iterations

  Number of observations                           400

  Estimator                                         ML
  Minimum Function Test Statistic                8.069
  Degrees of freedom                                 5
  P-value (Chi-square)                           0.152

Parameter Estimates:

  Information                                 Expected
  Standard Errors