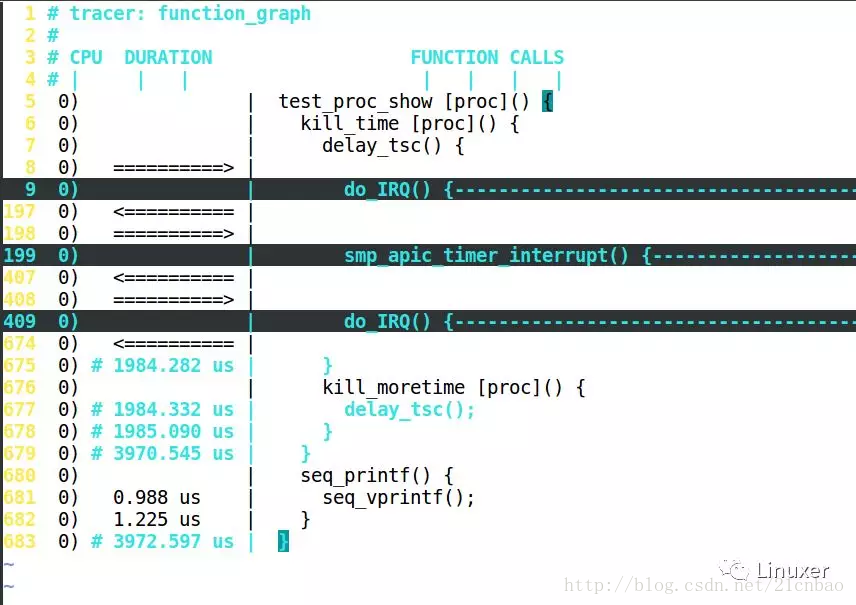
数的前面显示它占用的时间,如果是非叶子,要等到 }的时候,再显示时间,如下图:
延迟比较大的部分,会有+、#等特殊标号:
'$' - greater than 1 second
 '@' - greater than 100 milisecond
 '*' - greater than 10 milisecond
 '#' - greater than 1000 microsecond
 '!' - greater than 100 microsecond
 '+' - greater than 10 microsecond
 ' ' - less than or equal to 10 microsecond.
vim对Ftrace进行折叠
上面那个Ftrace文件太大了,大到看不清。我们可以用vim来折叠之,不过需要一个vim的特别配置,我把它存放在了我的~目录,名字叫.fungraph-vim:
" Enable folding for ftrace function_graph traces.

"

" To use, :source this file while viewing a function_graph trace, or use vim's

" -S option to load from the command-line together with a trace.  You can then

" use the usual vim fold commands, such as "za", to open and close nested

" functions.  While closed, a fold will show the total time taken for a call,

" as would normally appear on the line with the closing brace.  Folded

" functions will not include finish_task_switch(), so folding should remain

" relatively sane even through a context switch.

"

" Note that this will almost certainly only work well with a

" single-CPU trace (e.g. trace-cmd report --cpu 1).


function! FunctionGraphFoldExpr(lnum)

  let line = getline(a:lnum)

  if line[-1:] == '{'

    if line =~ 'finish_task_switch() {$'

      return '>1'

    endif

    return 'a1'

  elseif line[-1:] == '}'

    return 's1'

  else

    return '='

  endif

endfunction


function! FunctionGraphFoldText()

  let s = split(getline(v:foldstart), '|', 1)

  if getline(v:foldend+1) =~ 'finish_task_switch() {$'

    let s[2] = ' task switch  '

  else

    let e = split(getline(v:foldend), '|', 1)

    let s[2] = e[2]

  endif

  return join(s, '|')

endfunction


setlocal foldexpr=FunctionGraphFoldExpr(v:lnum)

setlocal foldtext=FunctionGraphFoldText()

setlocal foldcolumn=12

setlocal foldmethod=expr
之后我们配置vim为这个模板来打开前面那个600多行的文件1:
vim -S ~/.fungraph-vim 1
这样我们看到的样子是:

我们可以把光标移动到第5行,键盘敲打za,则展开为:

我们可以用z、a两个按键,搜索或者展开Ftrace的结果。
最后,https://github.com/brendangregg/perf-tools对Ftrace的功能进行了很好的封装和集成,建议大家用perf-tools来使用Ftrace,则效果更佳更简单。