|
et_ticklabels([x - 1 for x in range(0, len(X_) + 3, 2)])
# This last line outputs
# [-1, 1, 3, 5, 7, 9, 11, 13, 15, 17, 19, 21, 23, 25, 27, 29, 31, 33, 35]
# and we mark the tickers every two positions.
ax.xaxis.set_tick_params(length = 2, color = "#4E616C", labelcolor = "#4E616C", labelsize = 6)
ax.yaxis.set_tick_params(length = 2, color = "#4E616C", labelcolor = "#4E616C", labelsize = 6)
ax.spines["bottom"].set_edgecolor("#4E616C")
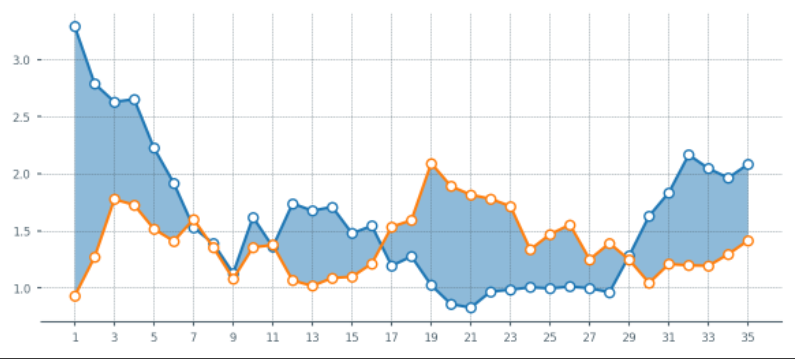
4.3 优化:设置填充
fig, ax = plt.subplots(figsize = (7,3), dpi = 200)
Python学习交流群:748989764
# --- Remove spines and add gridlines
ax.spines["left"].set_visible(False)
ax.spines["top"].set_visible(False)
ax.spines["right"].set_visible(False)
ax.grid(ls = "--", lw = 0.25, color = "#4E616C")
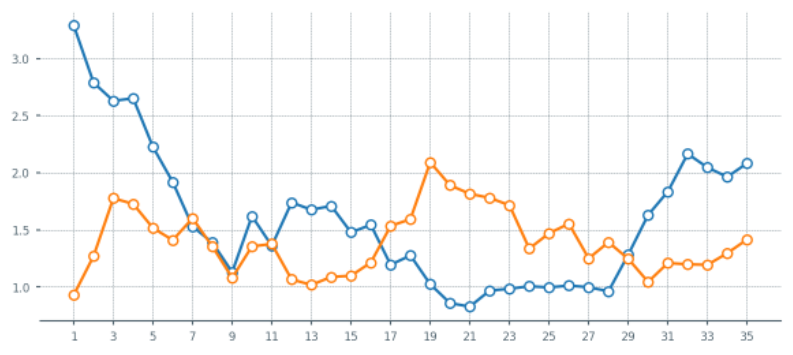
# --- The data
ax.plot(X_, Y_for, marker = "o", mfc = "white", ms = 5)
ax.plot(X_, Y_ag, marker = "o", mfc = "white", ms = 5)
# --- Fill between
ax.fill_between(x = X_, y1 = Y_for, y2 = Y_ag, alpha = 0.5)
# --- Adjust tickers and spine to match the style of our grid
ax.xaxis.set_major_locator(ticker.MultipleLocator(2)) # ticker every 2 matchdays
xticks_ = ax.xaxis.set_ticklabels([x - 1 for x in range(0, len(X_) + 3, 2)])
ax.xaxis.set_tick_params(length = 2, color = "#4E616C", labelcolor = "#4E616C", labelsize = 6)
ax.yaxis.set_tick_params(length = 2, color = "#4E616C", labelcolor = "#4E616C", labelsize = 6)
ax.spines["bottom"].set_edgecolor("#4E616C")
4.4 优化:设置填充颜色
1.当橙色线更高时,希望填充为橙色。但是上面的还无法满足,这里再优化一下.
fig, ax = plt.subplots(figsize = (7,3), dpi = 200)

# --- Remove spines and add gridlines

ax.spines["left"].set_visible(False)
ax.spines["top"].set_visible(False)
ax.spines["right"].set_visible(False)

ax.grid(ls = "--", lw = 0.25, color = "#4E616C")

# --- The data

ax.plot(X_, Y_for, marker = "o", mfc = "white", ms = 5)
ax.plot(X_, Y_ag, marker = "o", mfc = "white", ms = 5)

# --- Fill between

# Identify points where Y_for > Y_ag

pos_for = (Y_for > Y_ag)
ax.fill_between(x = X_[pos_for], y1 = Y_for[pos_for], y2 = Y_ag[pos_for], alpha = 0.5)

pos_ag = (Y_for <= Y_ag)
ax.fill_between(x = X_[pos_ag], y1 = Y_for[pos_ag], y2 = Y_ag[pos_ag], alpha = 0.5)

# --- Adjust tickers and spine to match the style of our grid

ax.xaxis.set_major_locator(ticker.MultipleLocator(2)) # ticker every 2 matchdays
xticks_ = ax.xaxis.set_ticklabels([x - 1 for x in range(0, len(X_) + 3, 2)])

ax.xaxis.set_tick_params(length = 2, color = "#4E616C", labelcolor = "#4E616C", labelsize = 6)
ax.yaxis.set_tick_params(length = 2, color = "#4E616C", labelcolor = "#4E616C", labelsize = 6)

ax.spines["bottom"].set_edgecolor("#4E616C")
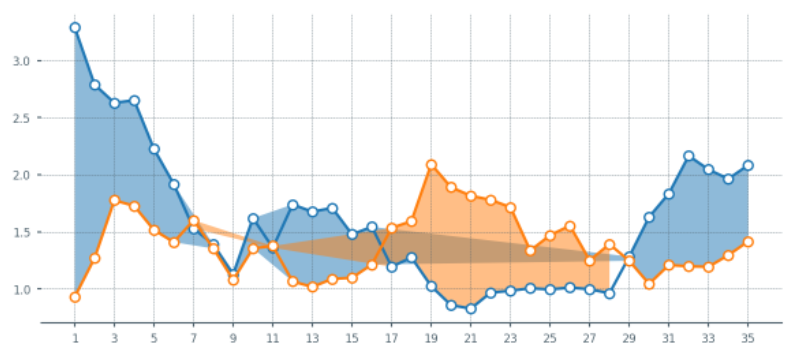
上面的图出现异常,再修改一下:
X_aux = X_.copy()
X_aux.index = X_aux.index * 10 # 9 aux points in between each match
last_idx = X_aux.index[-1] + 1
X_aux = X_aux.reindex(range(last_idx))
X_aux = X_aux.interpolate()


# --- Aux series for the xG created (Y_for)
Y_for_aux = Y_for.copy()
Y_for_aux.index = Y_for_aux.index * 10
last_idx = Y_for_aux.index |