|
[-1] + 1
Y_for_aux = Y_for_aux.reindex(range(last_idx))
Y_for_aux = Y_for_aux.interpolate()
# --- Aux series for the xG conceded (Y_ag)
Y_ag_aux = Y_ag.copy()
Y_ag_aux.index = Y_ag_aux.index * 10
last_idx = Y_ag_aux.index[-1] + 1
Y_ag_aux = Y_ag_aux.reindex(range(last_idx))
Y_ag_aux = Y_ag_aux.interpolate()
fig, ax = plt.subplots(figsize = (7,3), dpi = 200)
# --- Remove spines and add gridlines
ax.spines["left"].set_visible(False)
ax.spines["top"].set_visible(False)
ax.spines["right"].set_visible(False)
ax.grid(ls = "--", lw = 0.25, color = "#4E616C")
# --- The data
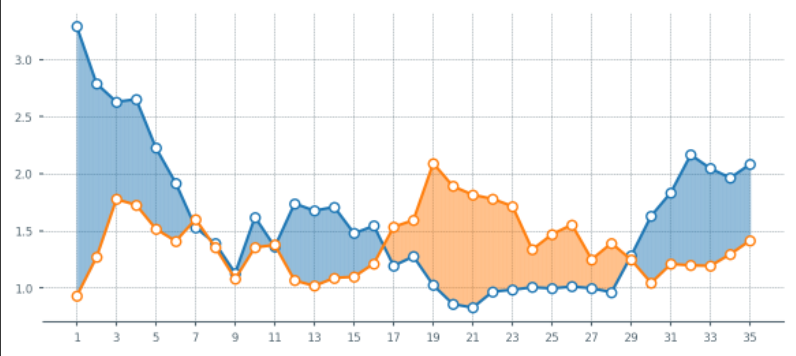
for_ = ax.plot(X_, Y_for, marker = "o", mfc = "white", ms = 5)
ag_ = ax.plot(X_, Y_ag, marker = "o", mfc = "white", ms = 5)
# --- Fill between
for index in range(len(X_aux) - 1):
# Choose color based on which line's on top
if Y_for_aux.iloc[index + 1] > Y_ag_aux.iloc[index + 1]:
color = for_[0].get_color()
else:
color = ag_[0].get_color()
# Fill between the current point and the next point in pur extended series.
ax.fill_between([X_aux[index], X_aux[index+1]],
[Y_for_aux.iloc[index], Y_for_aux.iloc[index+1]],
[Y_ag_aux.iloc[index], Y_ag_aux.iloc[index+1]],
color=color, zorder = 2, alpha = 0.2, ec = None)
# --- Adjust tickers and spine to match the style of our grid
ax.xaxis.set_major_locator(ticker.MultipleLocator(2)) # ticker every 2 matchdays
xticks_ = ax.xaxis.set_ticklabels([x - 1 for x in range(0, len(X_) + 3, 2)])
ax.xaxis.set_tick_params(length = 2, color = "#4E616C", labelcolor = "#4E616C", labelsize = 6)
ax.yaxis.set_tick_params(length = 2, color = "#4E616C", labelcolor = "#4E616C", labelsize = 6)
ax.spines["bottom"].set_edgecolor("#4E616C")
5. 把功能打包成函数
上面的样子都还不错啦,接下来把这些东西都打包成一个函数。方便后面直接出图。
def plot_xG_rolling(team, ax, window = 5, color_for = "blue", color_ag = "orange", data = df):
  '''
  This function creates a rolling average xG plot for a given team and rolling
  window.

  team (str): The team's name
  ax (obj): a Matplotlib axes.
  window (int): The number of periods for our rolling average.
  color_for (str): A hex color code for xG created.
  color_af (str): A hex color code for xG conceded.
  data (DataFrame): our df with the xG data.
  '''

  # -- Prepping the data
  home_df = data.copy()
  home_df = home_df.melt(id_vars = ["date", "home_team_name", "away_team_name"])
  home_df["venue"] = "H"
  home_df.rename(columns = {"home_team_name":"team", "away_team_name":"opponent"}, inplace = True)
  home_df.replace({"variable":{"home_team_xG":"xG_for", "away_team_xG":"xG_ag"}}, inplace = True)

  away_df = data.copy()
  away_df = away_df.melt(id_vars = ["date", "away_team_name", "home_team_name"])
  away_df["venue"] = "A"
  away_df.rename(columns = {"away_team_name":"team", "home_team_name":"opponent"}, inplace = True)
away_df.replace({"variable":{"away_team_xG":"xG_for", "home_team_xG":"xG_ag" |