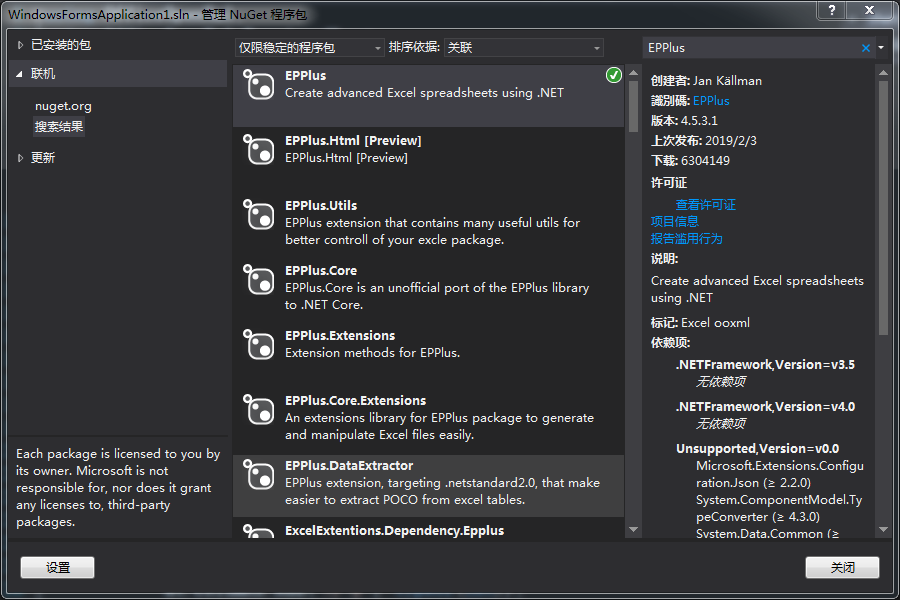
一 在negut添加EPPlus.dll库文件。
之前有写过直接只用Microsoft.Office.Interop.Excel 导出EXCEL,并生成Chart表,非常耗时,所以找了个EPPlus控件。
二 代码部分
System.Data.DataTable dt = new System.Data.DataTable();
            dt.Columns.Add("序号", typeof(int));
            dt.Columns.Add("数据1", typeof(int));
            dt.Columns.Add("数据2", typeof(int));
            Random r = new Random();
            for (int i = 0; i < 20; i++)
            {
                if (i == 6 || i == 16) continue;
                dt.Rows.Add(i + 1, r.Next(50), r.Next(60));
            }
            ////新建一个 Excel 文件
            //string filePath = @"C:\Users\Lenovo\Desktop\" + DateTime.Now.ToString("yyyy-MM-dd-HH-mm-ss") + ".xlsx";
            //FileStream fileStream = new FileStream(filePath, FileMode.Create);

            ////加载这个 Excel 文件
            //ExcelPackage package = new ExcelPackage(fileStream);

            //加载这个 Excel 文件
            ExcelPackage package = new ExcelPackage();

            // 添加一个 sheet 表
            ExcelWorksheet worksheet = package.Workbook.Worksheets.Add("数据");
            //添加个chart表
            ExcelWorksheet shapesheet = package.Workbook.Worksheets.Add("Chart");
            shapesheet.View.ShowGridLines = false;//去掉sheet的网格线
            shapesheet.Cells.Style.Fill.PatternType = ExcelFillStyle.Solid;
            shapesheet.Cells.Style.Fill.BackgroundColor.SetColor(Color.SkyBlue);

            //worksheet.View.ShowGridLines = false;//去掉sheet的网格线

            #region 生成chart表
            ExcelChartSerie serie = null;
            ExcelChart chart = shapesheet.Drawings.AddChart("chart", eChartType.LineMarkers);
            //chart.Legend.Position = eLegendPosition.TopRight;
            chart.SetPosition(5, 5);
            chart.Legend.Add();
            chart.Title.Text = "测试";
            chart.ShowHiddenData = true;
            chart.SetSize(1000, 600);//设置图表大小

            chart.XAxis.Title.Text = "CNC";
            chart.XAxis.Title.Font.Size = 10;

            chart.YAxis.Title.Text = "Value";
            chart.YAxis.Title.Font.Size = 10;

            #endregion


            int rowIndex = 1;   // 起始行为 1
            int colIndex = 1;   // 起始列为 1

            //设置列名
            for (int i = 0; i < dt.Columns.Count; i++)
            {
                worksheet.Cells[rowIndex, colIndex + i].Value = dt.Columns[i].ColumnName;
                //字体
                worksheet.Cells[rowIndex, colIndex + i].Style.Font.Name = "Arial";
                //字体加粗
                worksheet.Cells[rowIndex, colIndex + i].Style.Font.Bold = true;
                //字体大小
                worksheet.Cells[rowIndex, colIndex + i].Style.Font.Size = 12;
                //自动调整列宽,也可以指定最小宽度和最大宽度
                worksheet.Column(colIndex + i).AutoFit();

                if (colIndex + i > 1)
                {
                    serie = chart.Series.Add(worksheet.Cells[2, colIndex + i, dt.Rows.Count + 1, colIndex + i], worksheet.Cells[2, 1, dt.Rows.Count + 1, 1]);
                    serie.HeaderAddress = worksheet.Cells[1, colIndex + i];
                }
            }

            // 跳过第一列列名
            rowIndex++;

            //写入数据
            for (int i = 0; i < dt.Rows.Count; i++)
            {
                for (int j = 0; j < dt.Columns.Count; j++)
                {
                    //worksheet.Cells[rowIndex + i, colIndex + j].Style.Numberformat.Format = "0.00";
                    worksheet.Cells[rowIndex + i, colIndex + j].Value = double.Parse(dt.Rows[i][j].ToString());
                }

                //自动调整行高
                worksheet.Row(rowIndex + i).CustomHeight = true;


            }

            //添加chart数据,chart.Series.Add()方法所需参数为:chart.Series.Add(X轴数据区,Y轴数据区)
            //serie = chart.Series.Add(worksheet.Cells[2, 2, dt.Rows.Count + 1, 2], worksheet.Cells[2, 1, dt.Rows.Count + 1, 1]);
            //serie.HeaderAddress = worksheet.Cells[1, 2];
          //chartSerie = chart.Series.Add(worksheet.Cells[row + 1, 2, row + 1, 2 + dataPe