1 <!-- echartscom.vue -->
2 <template>
3 <div class="charttest">
4 <div style="width:400px;height:400px;" :id="echarts" class="echarts" ref="echarts">
5 </div>
6 </div>
7 </template>
8
9 <script>
10 import echarts from 'echarts'
11 export default {
12 name:'echartscom',
13 props: {
14 chartData: {
15 type: Array,
16 default: () => []
17 }
18 },
19 data() {
20 return {
21 };
22 },
23 methods: {
24 drawCharts() {
25 var myChart = echarts.init(document.getElementById(this.echarts));
26 myChart.setOption({
27 tooltip: {
28 trigger: 'item',
29 formatter: '{a} <br/>{b}: {c} ({d}%)'
30 },
31 legend: {
32 orient: 'vertical',
33 x: 'left',
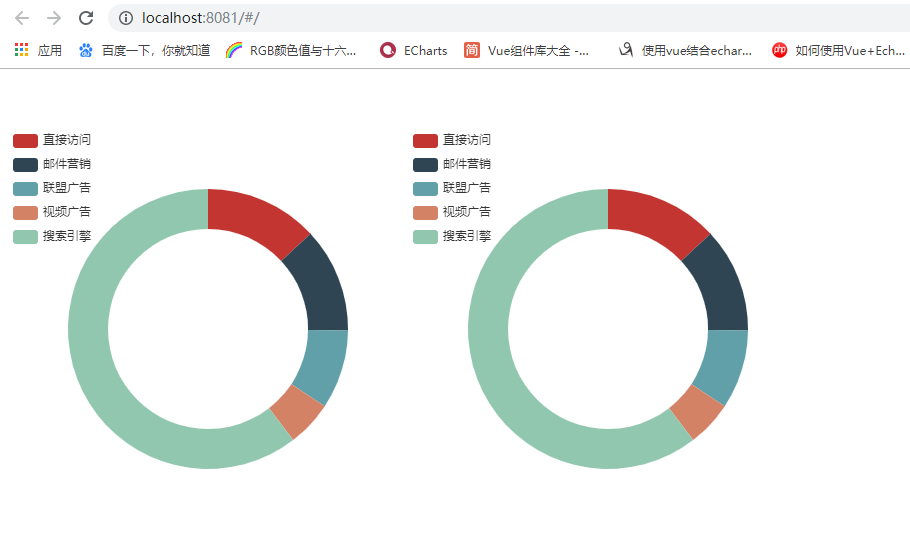
34 data: ['直接访问', '邮件营销', '联盟广告', '视频广告', '搜索引擎']
35 },
36 series: [
37 {
38 name: '访问来源',
39 type: 'pie',
40 radius: ['50%', '70%'],
41 avoidLabelOverlap: false,
42 label: {
43 normal: {
44 show: false,
45 position: 'center'
46 },
47 emphasis: {
48 show: true,
49 textStyle: {
50 fontSize: '30',
51 fontWeight: 'bold'
52 }
53 }
54 },
55 labelLine: {
56 normal: {
57 show: false
58 }
59 },
60 data: this.chartData
61 }
62 ]
63 });
64 }
65 },
66 computed: {
67 echarts() {
68 return 'echarts' + Math.random() * 100000;
69 }
70 },
71 mounted() {
72 this.drawCharts();
73 },
74 components: {}
75 };
76 </script>
77
78 <style></style>