lot->graph(0)->setData(x, y, true);
// 设置标题
customPlot->plotLayout()->insertRow(0);
customPlot->plotLayout()->addElement(0, 0, new QCPTextElement(customPlot, "Test-Title", QFont("sans", 17, QFont::Bold)));
// 设置坐标轴标签
customPlot->xAxis->setLabel("x");
customPlot->yAxis->setLabel("y");
// 设置坐标轴范围
customPlot->xAxis->setRange(-0.5, 0.5);
customPlot->yAxis->setRange(-1, 1);
// 刷新显示
customPlot->replot();
}
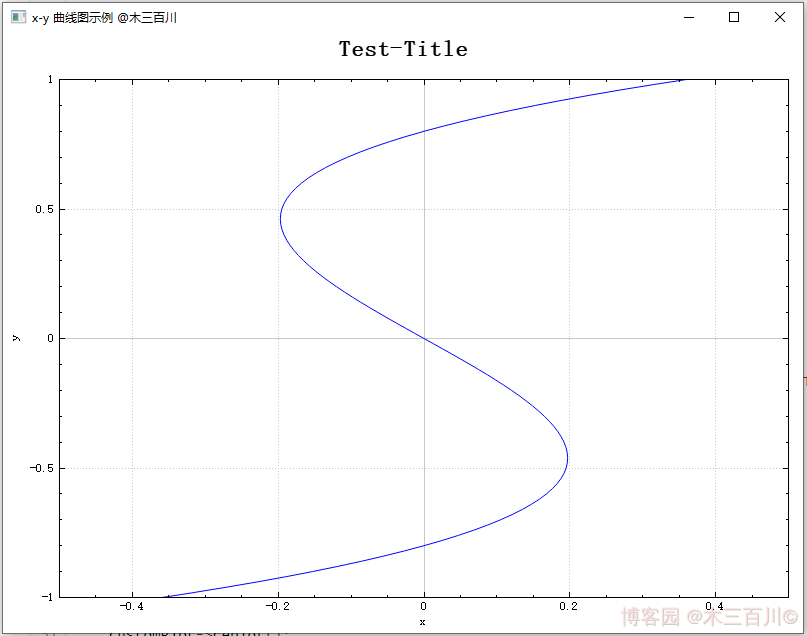
绘制效果:

注意这张图中,keyData (横轴)满足先递增再减小、且减小时的最小值(约为 -0.197)大于 keyData[0](约为 -0.360),所以绘制没有出错。有兴趣的可以尝试一下,当横轴数据减小且比较接近 keyData[0] 时,绘制的效果。
5.3 备用方法:导出绘图数据内存地址
关于如何导出一维绘图数据的内存地址,详见本人另一篇文章 【QCustomPlot】性能提升之修改源码(版本 V2.x.x)。demoPlot() 函数如下:
void demoPlot(QCustomPlot *customPlot)
{
    // 显示上方横轴(xAxis2)与右方纵轴(yAxis2),并与xAxis/yAxis保持同步
    customPlot->axisRect()->setupFullAxesBox(true);

    // 新建QCPGraph对象,获得绘图数据的内存地址,并设置绘图数据
    customPlot->addGraph();
    QVector<QCPGraphData> *mData = customPlot->graph(0)->data()->coreData();
    mData->reserve(101);
    mData->resize(101);
    for (int i = 0; i < 101; ++i)
    {
        double y = i/50.0 - 1;
        (*mData)[i].key = (y+0.8)*y*(y-0.8);
        (*mData)[i].value = y;
    }

    // 设置标题
    customPlot->plotLayout()->insertRow(0);
    customPlot->plotLayout()->addElement(0, 0, new QCPTextElement(customPlot, "Test-Title", QFont("sans", 17, QFont::Bold)));

    // 设置坐标轴标签
    customPlot->xAxis->setLabel("x");
    customPlot->yAxis->setLabel("y");

    // 设置坐标轴范围
    customPlot->xAxis->setRange(-0.5, 0.5);
    customPlot->yAxis->setRange(-1, 1);

    // 刷新显示
    customPlot->replot();
}
绘制效果:
6. 绘制间隙中断的 x-y 曲线
当 keyAxis 数据中存在 NaN 时,绘制曲线会出现间隙中断的效果,demoPlot() 函数如下:
void demoPlot(QCustomPlot *customPlot)
{
    // 显示上方横轴(xAxis2)与右方纵轴(yAxis2),并与xAxis/yAxis保持同步
    customPlot->axisRect()->setupFullAxesBox(true);

    // 生成x-y数据, y=x^2, 定义域[-1,1]
    QVector<double> x(101), y(101);
    for (int i = 0; i < 101; ++i)
    {
        x[i] = i/50.0 - 1;
        y[i] = x[i]*x[i];
    }
    y[30] = qQNaN();
    y[60] = std::numeric_limits<double>::quiet_NaN();

    // 新建QCPGraph对象,并设置绘图数据
    customPlot->addGraph();
    customPlot->graph(0)->setData(x, y);

    // 设置标题
    customPlot->plotLayout()->insertRow(0);
    customPlot->plotLayout()->addElement(0, 0, new QCPTextElement(customPlot, "Test-Title", QFont("sans", 17, QFont::Bold)));

    // 设置坐标轴标签
    customPlot->xAxis->setLabel("x");
    customPlot->yAxis->setLabel("y");

    // 设置坐标轴范围
    customPlot->xAxis->setRange(-1, 1);
    customPlot->yAxis->setRange(0, 1);

    // 刷新显示
    customPlot->replot();
}
绘制效果:
